The U.S. cannabis industry has seen massive changes since the start of adult-use sales in Colorado nearly a decade ago. As legal access has expanded across the country, the industry has seen a huge amount of innovation, with brands cranking out cannabis products in every conceivable form factor. One form factor that has generated huge interest since legalization is the Beverage category.
Cannabis-Infused Beverages may not be the largest segment of the industry, or even the edible space, but cannabis Beverages are still an important piece of the legal cannabis industry. A familiar form factor to weed enthusiasts and new consumers alike, brands that take a careful approach to cannabis Beverages can grow their brand awareness and see strong sales growth.
US Cannabis Beverage Market Overview
Cannabis Beverages make up 1% of total cannabis sales across BDSA-tracked U.S. markets. That isn’t to say that Beverage sales are insignificant, as brands across the country have been able to expand their market share and see sales growth with Beverage ventures.
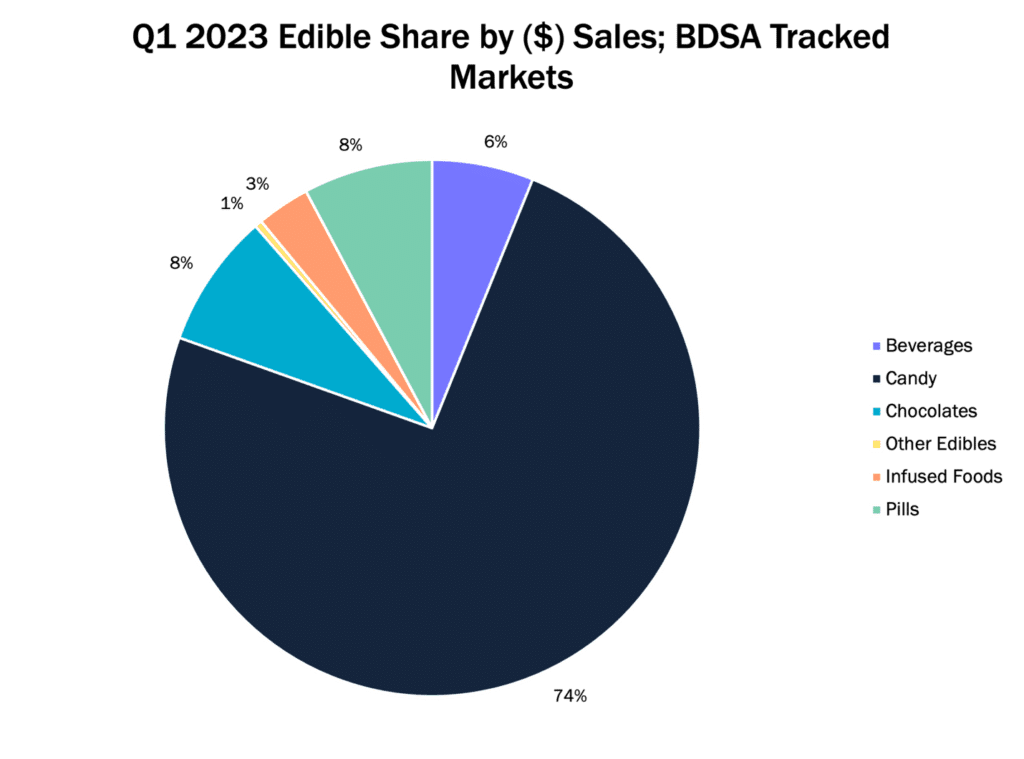
Across all BDSA-tracked markets, Beverages made up 6% of edible dollar sales in Q1 2023, making them the fourth largest edible category after Candy, Chocolates, and Pills.

[Source: BDSA Retail Sales Tracking, Q1 2023, All markets]
When we drill down to see how subcategories of the cannabis Beverage space perform, BDSA data show Drinks (ready to drink products, such as soda or lemonade) dominate the cannabis Beverage subcategory with 75%. Don’t be fooled, other beverage forms still show promising sales. Powdered Mixes and Shots hold a significant share of Beverage sales across all markets, with Powdered Mixes bringing in 10% of total U.S. Beverage dollar sales and Shots bringing in a 7% share. The Powdered Mix Beverages possess much stronger performance in select states. For example, BDSA data show that Powdered Mixes took up 28% of Beverage sales in Colorado in Q1 2023, and 99% of Beverage sales in New Jersey and New York (NY medical market only) (though this trend is likely due to the very limited Beverage brand presence in these Emerging markets).
Pricing and Pack Size Dynamics
Looking at the pricing trends in the space, Beverages are priced ~30% lower than the total edibles category on average. However, this figure refers to pricing per package; and doesn’t quite tell the full story when it comes to Beverage pricing. When we break down pricing by THC range, Beverages hold higher average retail prices (ARPs) than the total edible category when looking at products with lower THC ranges per package.
| Dosage (THC) | Average Retail Price: Total Edible Category | Average Retail Price: Beverages | Beverage Potency by Pack (share of $ sales) | Edible Potency by Pack (share of $ sales) |
| 10 mg – 19.99 mg | $6.48 | $7.98 | 5% | 2% |
| 20 mg – 29.99 mg | $11.13 | $9.86 | 5% | <1% |
| 50 mg- 59.99 mg | $12.03 | $9.88 | 2% | 2% |
| 100 mg – 109.99 mg | $14.85 | $11.67 | 46% | 61% |
[Source: BDSA Retail Sales Tracking, Q1 2023, All BDSA tracked markets]
This is explained by the fact that lower dose products make up a larger share of Beverage sales than Edible sales. Edibles are significantly more likely than Beverages to be high dose, with 61% of edible dollar sales coming from products with 100 mg THC, compared to just 46% in the Beverage category.
Further analysis of the varying innovative forms in the cannabis Beverage subcategory, showcases cannabis Tea Products as the subcategory with the highest Unit ARP in the Beverage subcategory ($29.34 in Q1 2023). After that, the priciest Beverage form was the Powdered Mix subcategory, ($16.16 in Q1 2023).
Brand and Product Landscape
With all the interest in the cannabis Beverages, both within and outside the industry, some might be wondering why doesn’t the subcategory hold a more dominant share of the Edible category? Aside from logistical challenges that Beverages present, from higher production and distribution costs to potential refrigeration requirements, one aspect that may be holding the category back is the limited brand and product landscape in the Beverage subcategory. There has been a significant expansion in the number of Beverage products available, as BDSA data shows a 37% increase in the number of distinct Beverage products between Q1 2021 and Q1 2023. In perspective, the more dominant Candy subcategory has many more brands and products available across every BDSA-tracked U.S. market.
| Category | SKU Count | Brand Count |
| Beverages | 863 | 134 |
| Candy | 5,574 | 415 |
| Chocolates | 1,236 | 149 |
| Pills | 750 | 93 |
[Source: BDSA Retail Sales Tracking, Q1 2023, All BDSA tracked markets]
Cannabis Beverages and The Cannabis Consumer
Even with all the opportunity in the Beverage space, building a winning cannabis Beverage venture is not a simple task. A thorough understanding of who the Beverage consumer is key piece to reaching market success.
Beverage Consumer Profile
Consumer data show that cannabis Beverage consumers are more likely to be male, and younger than the aggregate of all consumers. Per BDSA’s latest Consumer Insights wave, 59% of Beverage consumers were male, compared to 51% of all consumers. Younger consumers are also overrepresented among Beverage consumers, with 37% of Beverage consumers falling into the 25-34 years old bracket (+9% more than the aggregate of consumers).

[Source: BDSA Retail Sales Tracking; Spring 2023; Adult-Use and Medical Markets]
A look at consumption frequency trends reveals that cannabis Beverage consumers are less likely to consume Beverages daily. This is especially true when comparing to the much larger Inhalable consumer segment. The recent release of BDSA Consumer Insights data (wave 12) show that 37% of Beverage consumers claim to consume Beverages daily (vs. 66% of Inhalable consumers), while 63% claim to consume on a weekly basis or less than weekly (vs. 34% of Inhalable consumers). While this may seem like a barrier to Beverage sales growth, Consumer Insights data also show that some Beverage form factors see much higher daily consumption rates, such as Coffees, which 47% of Consumers claim to consume daily, showcasing that there are opportunities to boost consumption frequency among Beverage enthusiasts.
Beverage Consumers at Retail
Like the aggregate of all consumers, High THC content is one of the most cited drivers of cannabis product choice, with 39% of Beverage consumers claiming that High THC content is an influencer of their cannabis product choice. High CBD content factors into product choice significantly more among Beverage consumers than the aggregate of consumers, with 22% of Beverage consumers citing CBD content as a top product choice driver, compared to just 14% among the aggregate of consumers. Consumer data also show that brand reputation is a big deal to Beverage consumers. 21% of Beverage consumers claim that the reputation of a brand is an important driver of cannabis product choice, compared to 15% in the aggregate of all consumers.
When asked what factors influence their purchase of a cannabis beverage, “taste/flavor” and “ease of use” are the most often cited purchase drivers by Beverage Consumers. 55% cite “taste/flavor” as a top driver of their Beverage purchase, while 28% cite “ease of use” as a top Beverage purchase driver.
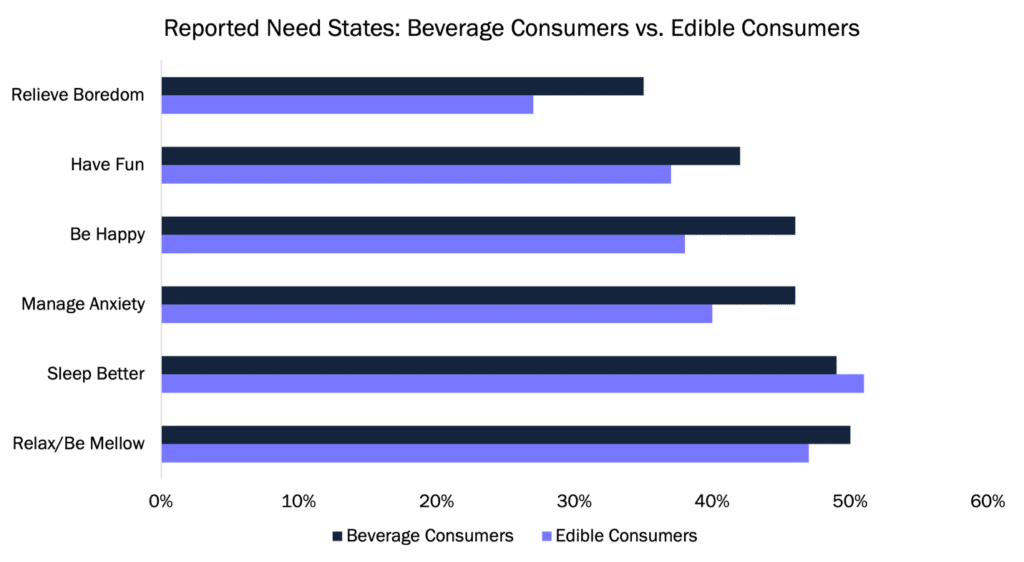
While cannabis Beverages may not command as much attention as some other subcategories in the legal U.S. cannabis space, there are plenty of reasons to be optimistic about this small but mighty product category. With continued product innovation and more brands expanding into the space, Beverages stand to benefit from the constantly growing consumer landscape, with many thirsty consumers already recognizing the unique need states that Beverages satiate.
With Beverages making up only 1% of total cannabis sales, the category is far from the biggest within the edible space, especially given logistical challenges that lead to increased costs for manufacturers, distributors and retailers. That said, Beverage products are still positioned to gain market share through adoption by new consumers, and BDSA Consumer data show that Beverage products are positioned to see growth from tapping into need states that they uniquely address, such as social consumption and active, high energy use occasions. Still curious about the potential of cannabis Beverages? Check out BDSA.com for more insights on this exciting category…

