Who says “cheers” before taking a hit of cannabis?
Lovers of pot beverages, that’s who.
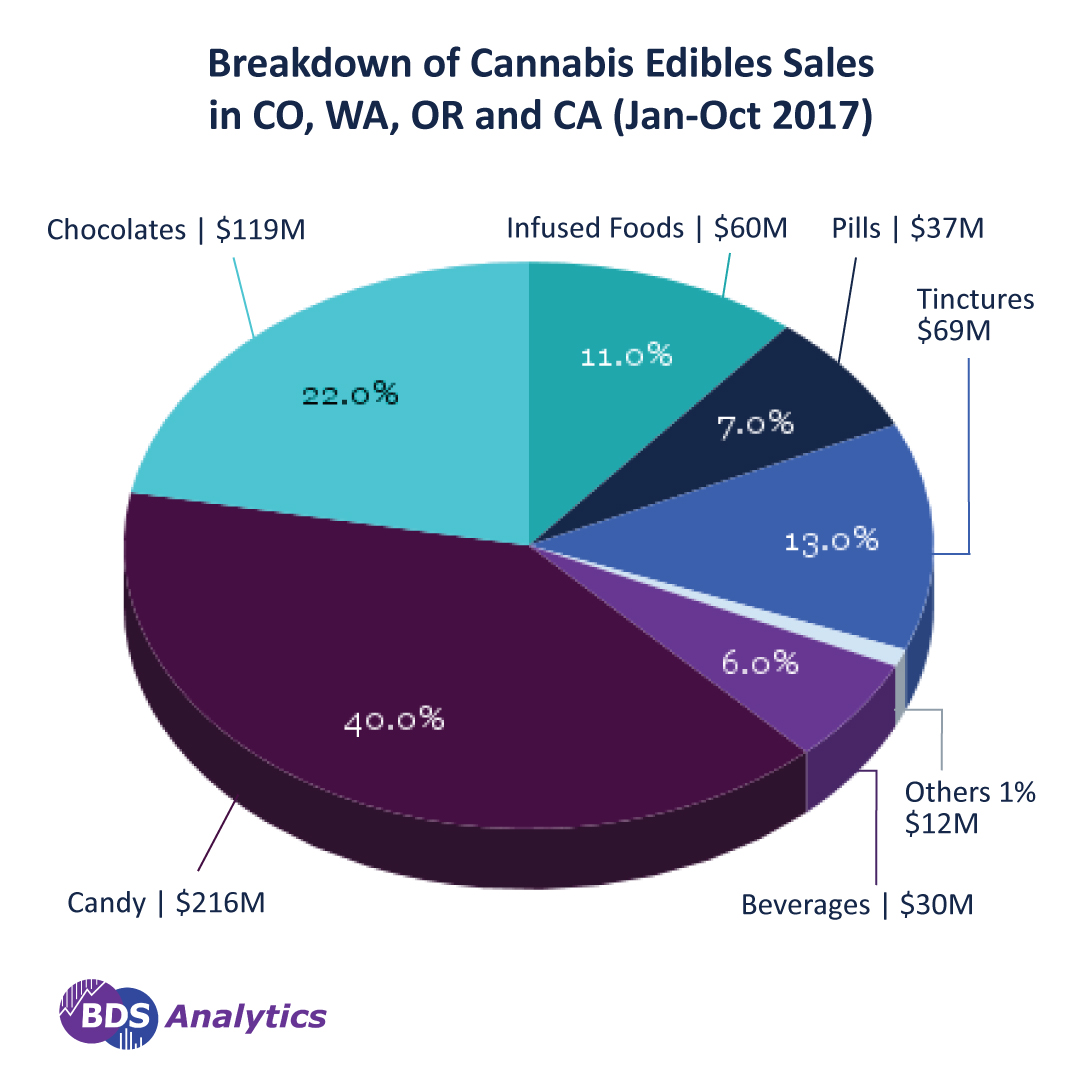
Sipping – rather than inhaling, chewing or slathering cannabis – remains a relatively niche activity. The cannabis beverage market captured 6 percent of the $543.3 million edibles market in CO, WA, OR and CA between January and October of 2017, on sales of $30.3 million.
But growth (excluding California, for which 2016 data is not available to measure growth) held strong, at a rate of 23 percent.
Divergent trends emerged in different states throughout the year, as consumers increasingly flirted with the idea of potable pot.
Consumers in all of the states we track crown the sub-category “drinks,” which includes things like soda and juice, as No. 1 for ganja to gulp. Additional sub-categories we track under the Beverage parent category include coffee, tea, shots, and others. We will delve more deeply into the “drinks” category shortly, but first let’s consider the unusual cannabis beverage market in Oregon.
Consumers in the Beaver State buy enough “drinks” to make it No. 1 in market share among all types of beverages. But where the category captures most of the beverage market (more than 80 percent) in other states, it commands only 53 percent of the beverage market in Oregon.
How else do Oregonians slurp their sativa? They like it hot. Specifically, they savor cannabis in their coffee and tea — and yes, some of the traditional coffee shop-products are in fact not hot, but bottled and chilled. The cannabis coffee market in Oregon represents 22 percent of beverage sales, while tea captures 10 percent. Together, they own 32 percent of Oregon’s beverage market, compared to less than 10 percent in the other states.
During the January through October period of last year registered an increase of 196 percent for coffee products, and an impressive 975 percent for tea. Both of the hot pot options remain small categories, in terms of dollars spent: $301,866 for coffee and $132,476 for tea.
But many categories often start with a whimper before evolving into a roar.
The drinks category captures the bulk of market share of beverage sales in all states (between January and October 2017), and growth bounces around between 67 percent in Washington to negative territory in Oregon, where growth fell by 34 percent (thank you, coffee and tea).
Roaring? Not quite. But it’s loud. In Colorado, California and Oregon non-carbonated drinks (sub-category of the drinks category) rule the roost: 60 percent of the drinks market in Colorado, 54 percent in California and 52 percent in Oregon.
And then there is Washington — the State of Soda. In Washington, carbonated drinks (sub of the drinks category like non-carbonated) capture 77 percent of the $6 million drinks market and growth hit 30.5 percent. That is fairly fizzy commercial activity.
Oregonians and java ganja. Washingtonians and soda pop (er, soda pot). Those quirky Pacific Northwesterners. What’s next, pot-cured salmon? Now there’s an idea.