We are excited to announce the new BDSA platform in GreenEdge®! The cannabis industry is quickly evolving, and we know how important it is to get the business actionable insights you need to stay ahead of the curve. This renovation makes getting insights and answers faster. And for the analyst-type minds, the enhanced features make accessing granular data easier than ever before.
New Functionality Gets You the Data That You Need Even Faster
In a fast-moving industry like legal cannabis, you need answers at your fingertips. The renovated BDSA enhanced dashboards make getting answers for your business easy and quick.
- New filter system allows users to access dashboard filters and quickly get the customized data set they need.
- Dashboard bookmarking feature allows for unlimited bookmarks so you can return to the answers you need on demand.
- Enhanced category dashboards offer pre-set (but still customizable!) data visualization to give you a quicker look into the most relevant product attributes and details.
Example Use Case: gauge the extracts product category in the Ohio market
Whether you’re investigating for product innovation, market or category expansion, or performance tracking. You can easily reference quick data points like ARP, sales, growth, share, and top brands.
The new category-specific dashboards provide more information on attributes specific to the extracts category, like product weight, strains, and the breakdown of formats including the Live attribute. Use this view to ensure you’re not missing an emerging trend and are tracking the price dynamics according to very specific product types.
Set a Bookmark pre-filtered to Ohio, the extracts category, and maybe even with a few other customizations based on how your executives have asked to see their reports.
| Filters | Quickly identify characteristics of best selling extracts with the easy to use filter system. | 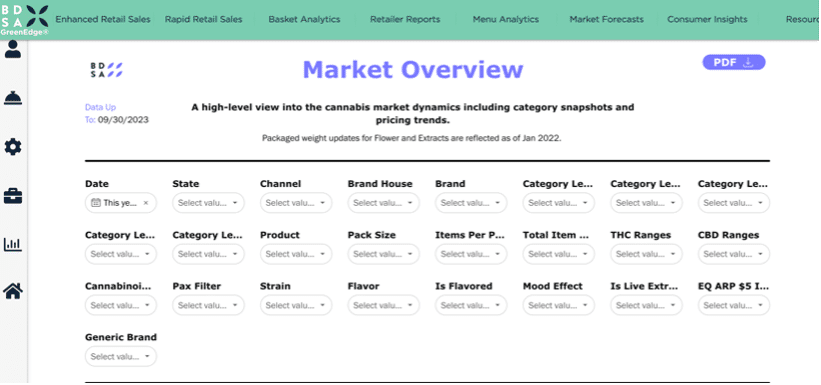 |
| Bookmarks | Customize and save unlimited pages to access your favorite views quickly. | 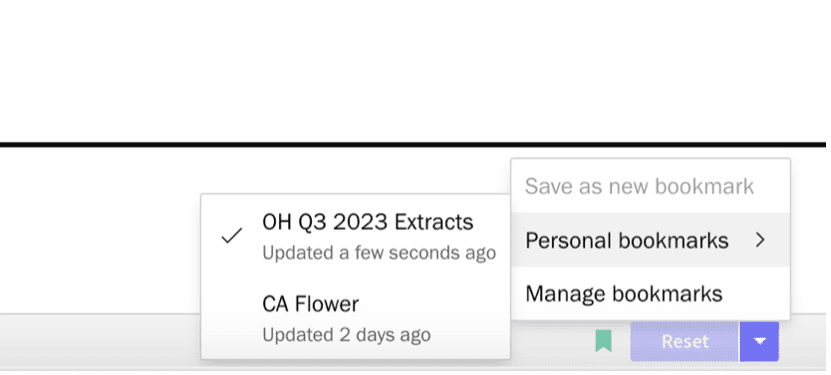 |
| Category Dashboards | Category attributes are at your fingertips with new category dashboards. | 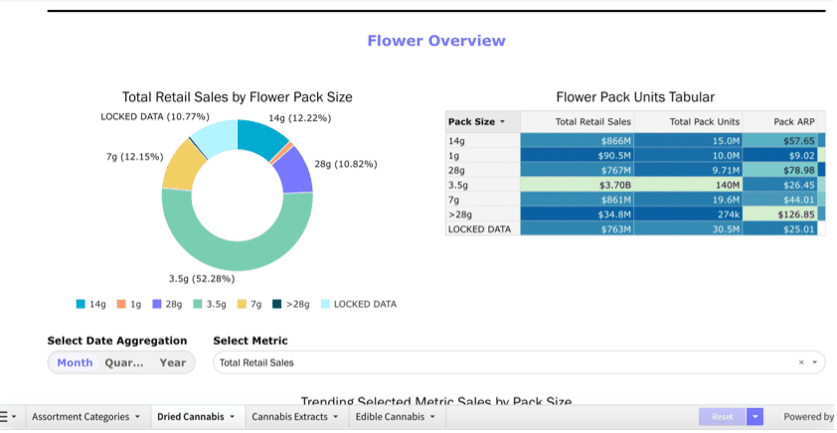 |
Assess your Competitive Landscape
Brands and retailers need to stay nimble to effectively compete, including having the competitive data at your fingertips.
The updates to BDSA’s Brand Performance dashboard were built to meet this need for rapid assessment of your own brand against key competitors, as well as market/category performance. With the overhauled Brand Performance dashboard, it’s faster than ever to see where your brand stacks up against the total market and 3 key competitors.
Example Use Case: Track Competitive in the Missouri Edible Market
BDSA’s Brand Performance updates include visualizations of brand performance, including sales, pricing, and growth for their own brand, competitors, and the edible category. This provides a view into whether a brand is growing at a faster or slower rate than the category and which brand(s) are taking market share.
| Brand Performance vs. Market | See how your brand or a competitors stacks up against the rest of the market: sales, price, and growth | 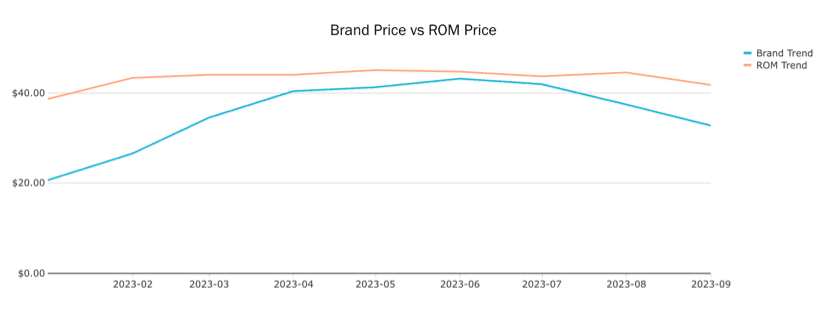 |
| Competitive Analysis Tools | Quickly assess your brands performance by market and category against multiple competitor brands | 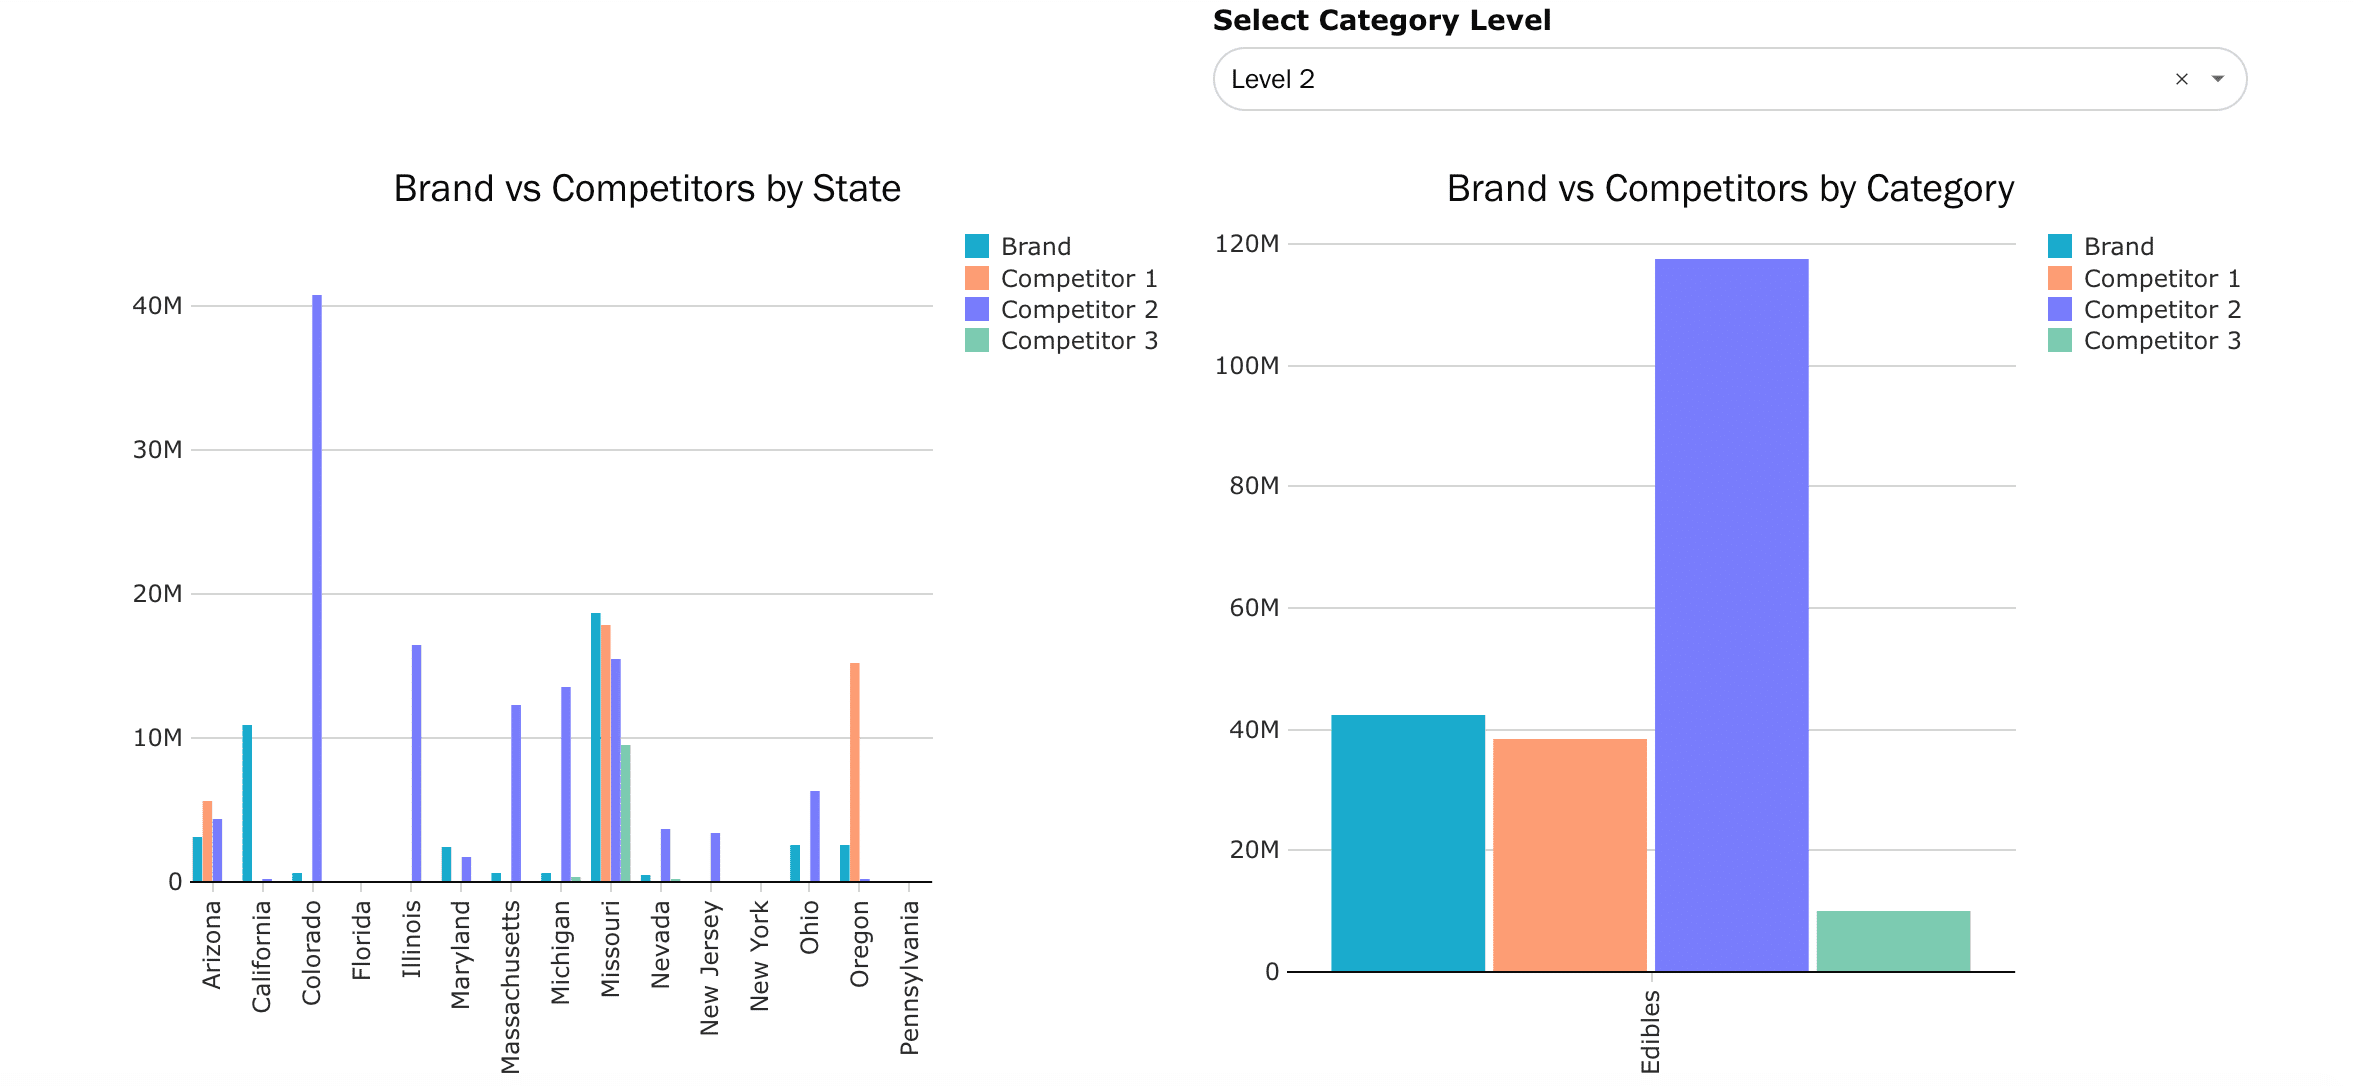 |
Get More Detailed and Granular Data
Rapid access to actionable insights is important, but sometimes cannabis businesses need to get into the nitty-gritty to solve tough problems. That’s why BDSA’s dashboards enable access to more detailed data than ever.
- New “maximize element” feature makes individual charts fully customizable, allowing users to pivot axes, swap out metrics and more.
- Enhanced drilling functionality enables users to drill down into any chart to see what’s driving a given brand or products performance.
- Basket Analytics Enhancements enable users to access new product cross-purchasing data, allowing retailers to utilize granular data to plan promotions and discounts with laser precision.
BDSA’s new maximize element feature allows you to derive detailed data from individual dashboard charts. This tool can transform a pie chart into a trended line chart, add in another series to compare two categories or markets, even change out the metrics entirely.
What about when you need to dive into the details to see what’s driving a trend? BDSA’s enhanced drilling feature gives users the ability to drill into a chart or data point to break down into more detailed information. For example, a brand can take a simple sales chart and drill to identify which price segments are driving the most volume at retail, then which brands and specific products make up the largest share in the leading price segment – all within one dynamic chart.
With enhanced product-level insights in Basket Analytics, this retailer can identify complementary products for more effective promotions and merchandising. This precision planning maximizes basket sizes and allows retailers and brands to optimize their product assortment to increase revenue.
| Maximize Element | Use maximize element feature to customize charts by swapping out metrics, switching axes and altering chart type. | 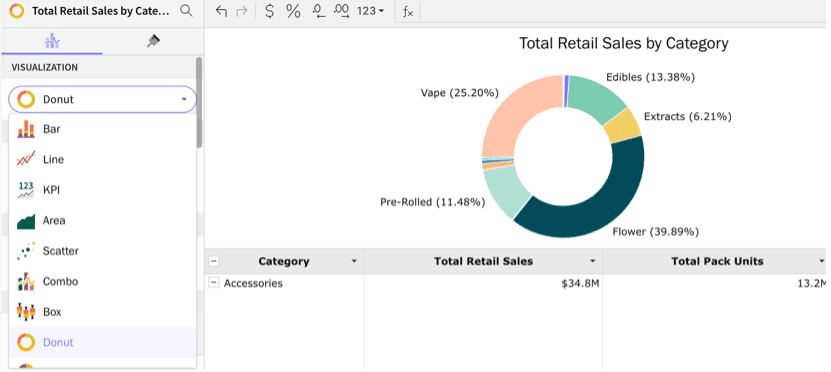 |
| Drilling | Drill down into specific chart segments to see whats driving the most recent trends. | 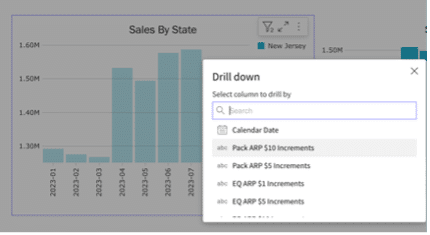 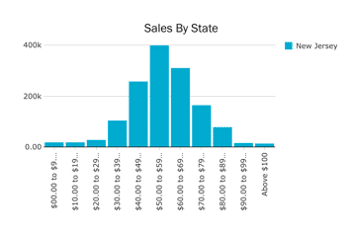 |
| Basket Analytics: Granular Cross-Purchasing | Assess cross-purchasing trends to strategize promotions at the brand and product level | 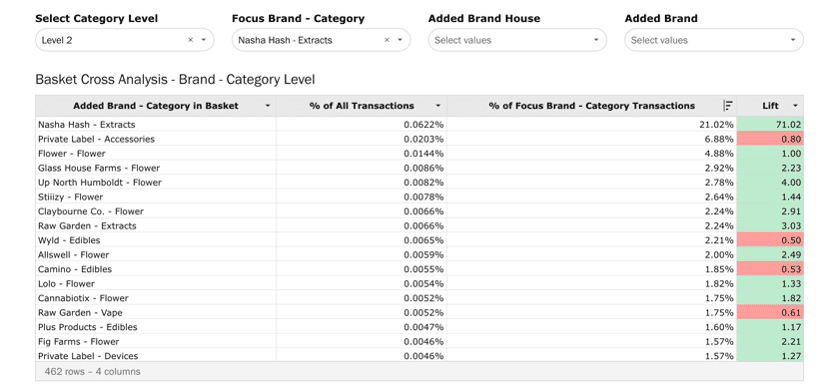 |
Whether you’re a brand, retailer, or investor looking for a quick answer or in-depth analysis, BDSA’s recent product enhancements make it easier than ever to get insights you need to propel your business forward.
Want to learn more about BDSA’s latest dashboard enhancements or how to leverage BDSA data for your business? Reach out to request a demo today!

