Among Colorado, Washington and Oregon, edibles ranked #3 in terms of market share of dollars sold during 2016, capturing 12 percent ($269.8 million) of the $2.33 billion cannabis market. Flower leads with 58 percent of the market, followed by concentrates at 20 percent.
When it comes to edibles, consumers in different states are not uniformly enthusiastic for the range of options, including chocolates, candies, infused foods, beverages and more.
Consider Colorado and Oregon during January of this year. The differences between consumer preferences in these states is striking.

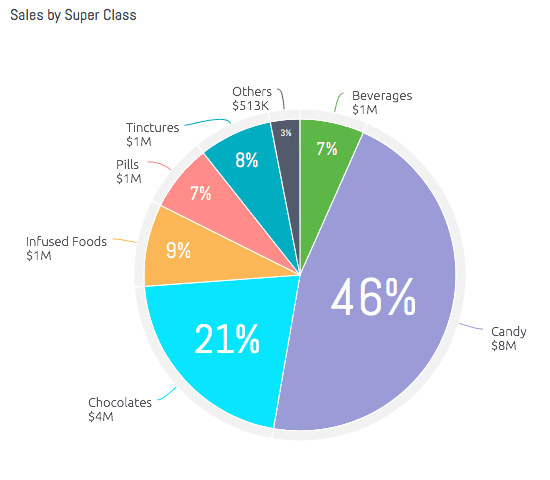
Tracking 2016 trends, Colorado consumers in January of this year made candy the market leader among edibles categories.
Coloradans are crazy for candy, spending $8 million on candy products during the month and capturing 46 percent of market share. If we look closely at the candy market, we see consumers in the Centennial State are especially crazy for gummy candies ($5 million in sales, capturing 63 percent of market share). Hard candy comes in second, grabbing 14 percent of market share on $1 million in sales.
Behind the broad candy category, in terms of dollar sales, we find chocolates. Consumers spent $4 million on chocolates in January, which captured 21 percent of the edibles market. Among the market leaders, next comes infused foods ($1 million, 9 percent of the market), then tinctures (8 percent), pills (7 percent) and beverages (7 percent).
Colorado may have started selling edibles recreationally long before Oregon (where edibles were first sold in the regulated adult-use market in June of 2016), but consumers in the Beaver State did not follow the candy trail blazed by Coloradans.

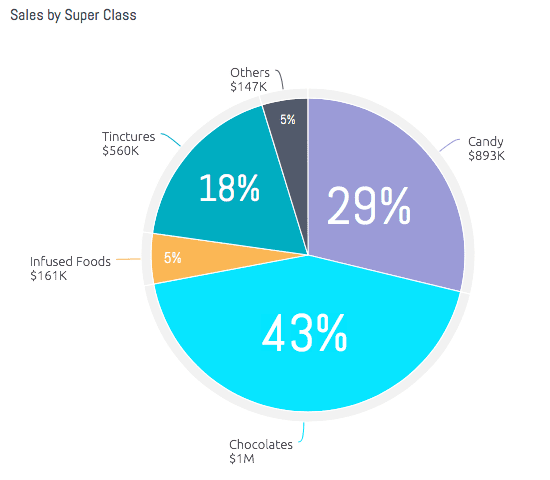
In Oregon, consumers preferred candy until the fall, when sales of chocolate began mounting. By January of this year, chocolate had become the No. 1 style of edible in the state.
In Oregon, chocolate is the market leader, capturing 43 percent of the market in January on $1 million in sales and 39 percent (also $1 million in sales) in February. Candy lags behind in second place, with 29 percent market share on $893,000 in sales for December and 28 percent market share in February on $946,000 in sales. Infused foods, like baked goods? Not yet. Oreganders prefer tinctures (which nabbed just 8 percent of the market in Colorado), which captured 18 percent of the market in both January and February. Infused foods represented just 5 percent of the market in January, with $161,000 in sales, but rose to 9 percent with $307,000 in sales in February.
One caveat: Due to immense regulatory snafus and hurdles in Oregon, brands and grows faced a range of problems getting their products onto dispensary shelves. Oregon consumers’ edibles preferences tracked Colorado’s fairly closely until the fall (when the regulatory problems began), when month by month we see chocolates gain on candy. By December of last year, the categories were nearly even. But during the first two months of 2017, we finally see chocolate pull ahead of candy. Did the regulatory problems influence consumer purchases? It is possible.
Either way, during the first two months of 2017 consumers turned chocolate into the No. 1 style of edible in Oregon.

