
Your source for real-time cannabis sales data.
Understand not just what is selling, but why and how efficiently, so you can optimize pricing, distribution, and promotions to maximize revenue and growth.
Don’t make decisions in the dark. Whether you’re launching a new product, expanding to new markets, or fine-tuning your pricing, BDSA’s Retail Sales Tracking gives you the clarity and confidence to act decisively. Our sales tracking platform delivers localized, real-time, SKU-level data so you know what’s moving off the shelves, at what price, and in which markets.
Enhanced Market Insight
Track evolving demand and high-performing products to stay responsive to market changes and sales trends.
Strategic Pricing Solutions
Adjust your pricing strategy based on real-time insights on how the market is evolving. Pricing is available by city or custom territories and by granular product categories and attributes to ensure you are evaluating the most applicable pricing dynamics.
Drive Product Developement
Spot emerging trends through BDSA’s innovation view and adapt your product offerings to stay ahead. Reduce risk by ensuring the opportunity size is growing and priced right based on your costs and goals.
Manage seasonality and demand
Maintain healthy inventory levels so you’re always ready to meet customer demand without excess costs, utilizing precise sales data and patterns.
Gain Competitive Edge
Utilize our detailed sales analytics to uncover unique selling opportunities within the cannabis market. Launch, extend, and price with confidence with data that reveals growing and shrinking opportunities along with the performance of your competitive landscape.
BDSA Retail Sales Tracking Product Details
Localized Market Insights
Analyze trends at the state, city, or custom territory level to understand the unique dynamics shaping your business.
Comprehensive Pricing Intelligence
Track menu prices, discounts, and actual purchase prices, with insights into discount impact and sales velocity to optimize pricing strategies.
Clean, Standardized Product Coding
Ensure accurate, reliable product tracking with a meticulously coded product database, making category analysis seamless.
CPG-Grade Performance Metrics
Gain a complete view of brand and market health with key metrics like Velocity (sales speed), %ACV (distribution reach), and Discount Lift (sales impact of promotions).
Basket Analytics
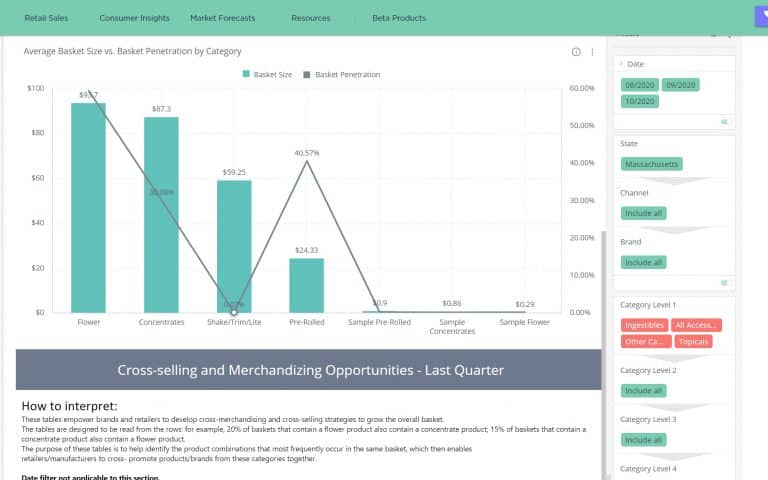
Develop cross-selling strategies at retail from insights derived from transactional-level data into the value and composition of shopper baskets. Develop category and brand cross-selling strategies at retail.
Attributes
Explore five levels of product categories, as well as an array of attributes, including cannabinoid mg (THC, CBD, CBN, CBG), pack size, pack count, flavor, and strain. Utilize the data to price precisely and foster innovation.
Brand & Brand House Intelligence
Compare sales by brand or brand house for clear competitive benchmarking and market positioning.
Greenedge
Rich, actionable data is delivered through BDSA’s GreenEdge® platform, designed to deliver quick answers, customizable charts, or comprehensive data exports - flexible based on your team’s needs and resourcing.
BDSA Retail Sales Tracking Capabilities
- Brand and Product Performance Tracking
- Optimize Pricing and Discounts
- Competitive Intel
- Informed Product Development
- Dispensary Basket Analytics
- Cannabis Brand House Tracking
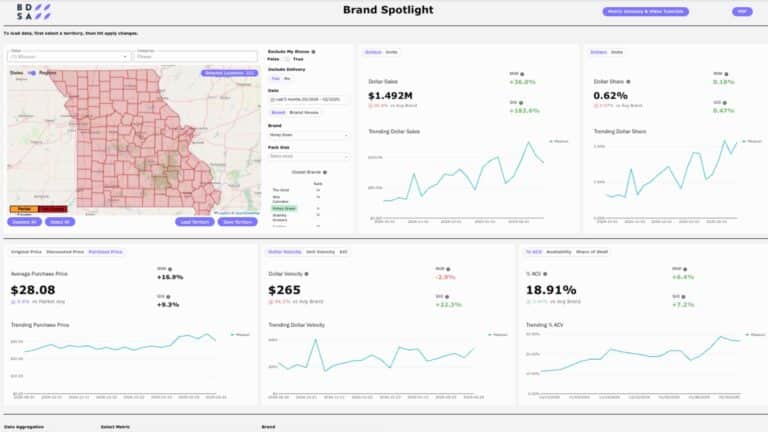
Evaluate a scorecard of KPIs for your brand or evaluate your closest competitors.
BDSA's interactive dashboards are designed to serve you quick insights on how your brand or competitive set is performing, and why. In addition to insight into trending sales, uncover brand and product velocity, availability, %ACV, share of shelf, and pricing to unpack the "why". Filter the board to show brand house, a custom-built sales territory, or a granular product category to tailor the insights to your needs.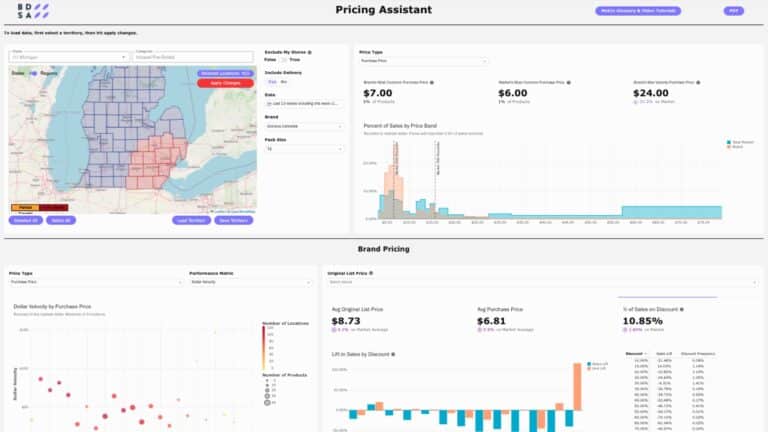
Use BDSA Pricing Insights to Stay Competitive and Profitable.
With detailed insights into final purchase prices, average list prices, discounted list prices, and the most common price points, you gain a deeper understanding of how your products, and competitive products are performing across different pricing levels. This granular visibility into price variations allows you to track the exact effect of various prices, discounts, and promotions on sales, helping you avoid over-discounting or underpricing products to maximize margins.
Tailor your pricing strategies to align with local market conditions and consumer behavior. Utilize built-in regions or customize reporting for your unique sales territories.
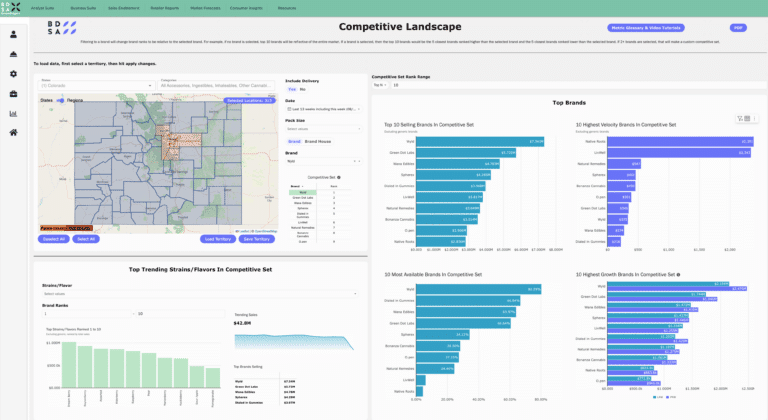
Stay ahead of the competition with the most actionable performance and competitive insights available.
BDSA will deliver the most relevant data to track your performance and that of your closest competitors, highlighting key drivers like availability, velocity, and pricing. See how brands are trending on essential metrics to understand what’s fueling growth or decline in market share. Don’t forget to zoom in locally as up-and-coming brands often own different segments of the market at a regional level.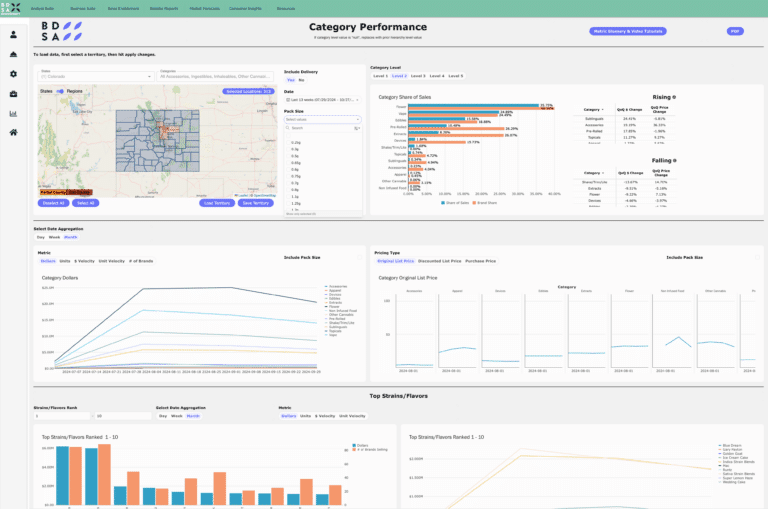
Stay ahead with an informed product strategy by spotting emerging trends and adapting offerings to meet evolving consumer demands.
Detailed product attributes such as form factor, cannabinoid profile, flavor, and size, offer a clear view of what truly matters when considering new products. Evaluate what’s gaining momentum, what commands premium price points, and where competitors have missed the mark, helping you reduce risk and focus on opportunities with real potential for success.
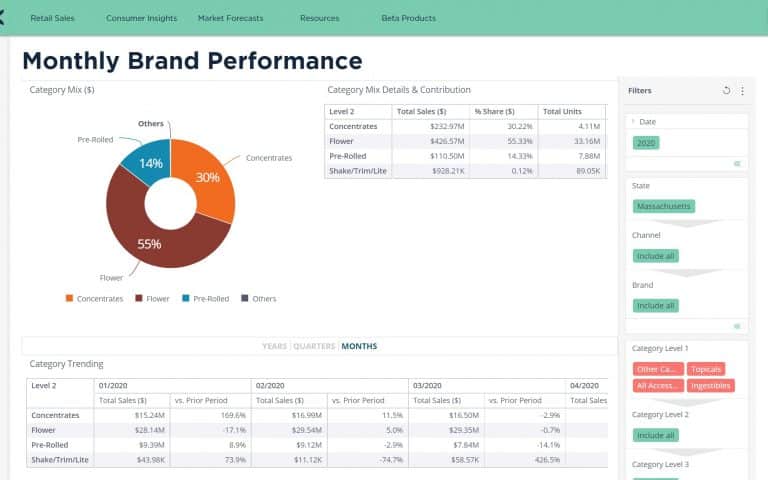
BDSA Dispensary Basket Analytics, filterable by market, category, brands, and products, provides insight into the value and composition of shopper baskets. This data helps manufacturers and retailers develop cross-selling and up-selling strategies to maximize sales.
- Maximize store and brand sales through deeper basket diagnostics with data drillable by market, channel, category, brand and SKU.
- Develop category, brand, and product cross-selling strategies.
- Craft powerful sales stories for optimal shelf space, perfect promotional planning, and marketing strategies.
- Identify category expansion opportunities for your brand based on frequent co-purchasing that is lost to another brand.
- Optimize assortment and shelf placement.
- Grow basket size and boost the sales velocity of smaller product categories by improving promotional strategies and budtender training.
BDSA’s Cannabis Brand House tracking offers insights into the sales performance of brands managed by parent companies. The dashboards and filters allow you to observe parent companies’ sales trends and market shares over time, and the brands, categories, and markets that are driving those sales.
- Gain visibility into cannabis market sales data on 450 BDSA-verified brand houses and their thousands of brands.
- Identify key investment opportunities with detailed market share breakdowns across markets and categories.
- Drill down by product category and brand to see the products and brands driving the parent company’s sales.
- Know how, when, and if you can compete with larger, growing “house of brands.”
A SOLUTION DESIGNED TO MEET YOUR NEEDS AND BUDGET
Business Suite
The most popular suite, designed for those that appreciate the value of data-driven decision-making and want a simple but incredibly effective tool.
Analyst Suite
For the most data savvy companies who want to uncover the story beneath the story through deep analysis of the underlying datasets.

Empower your business with BDSA Retail Sales Tracking.


